
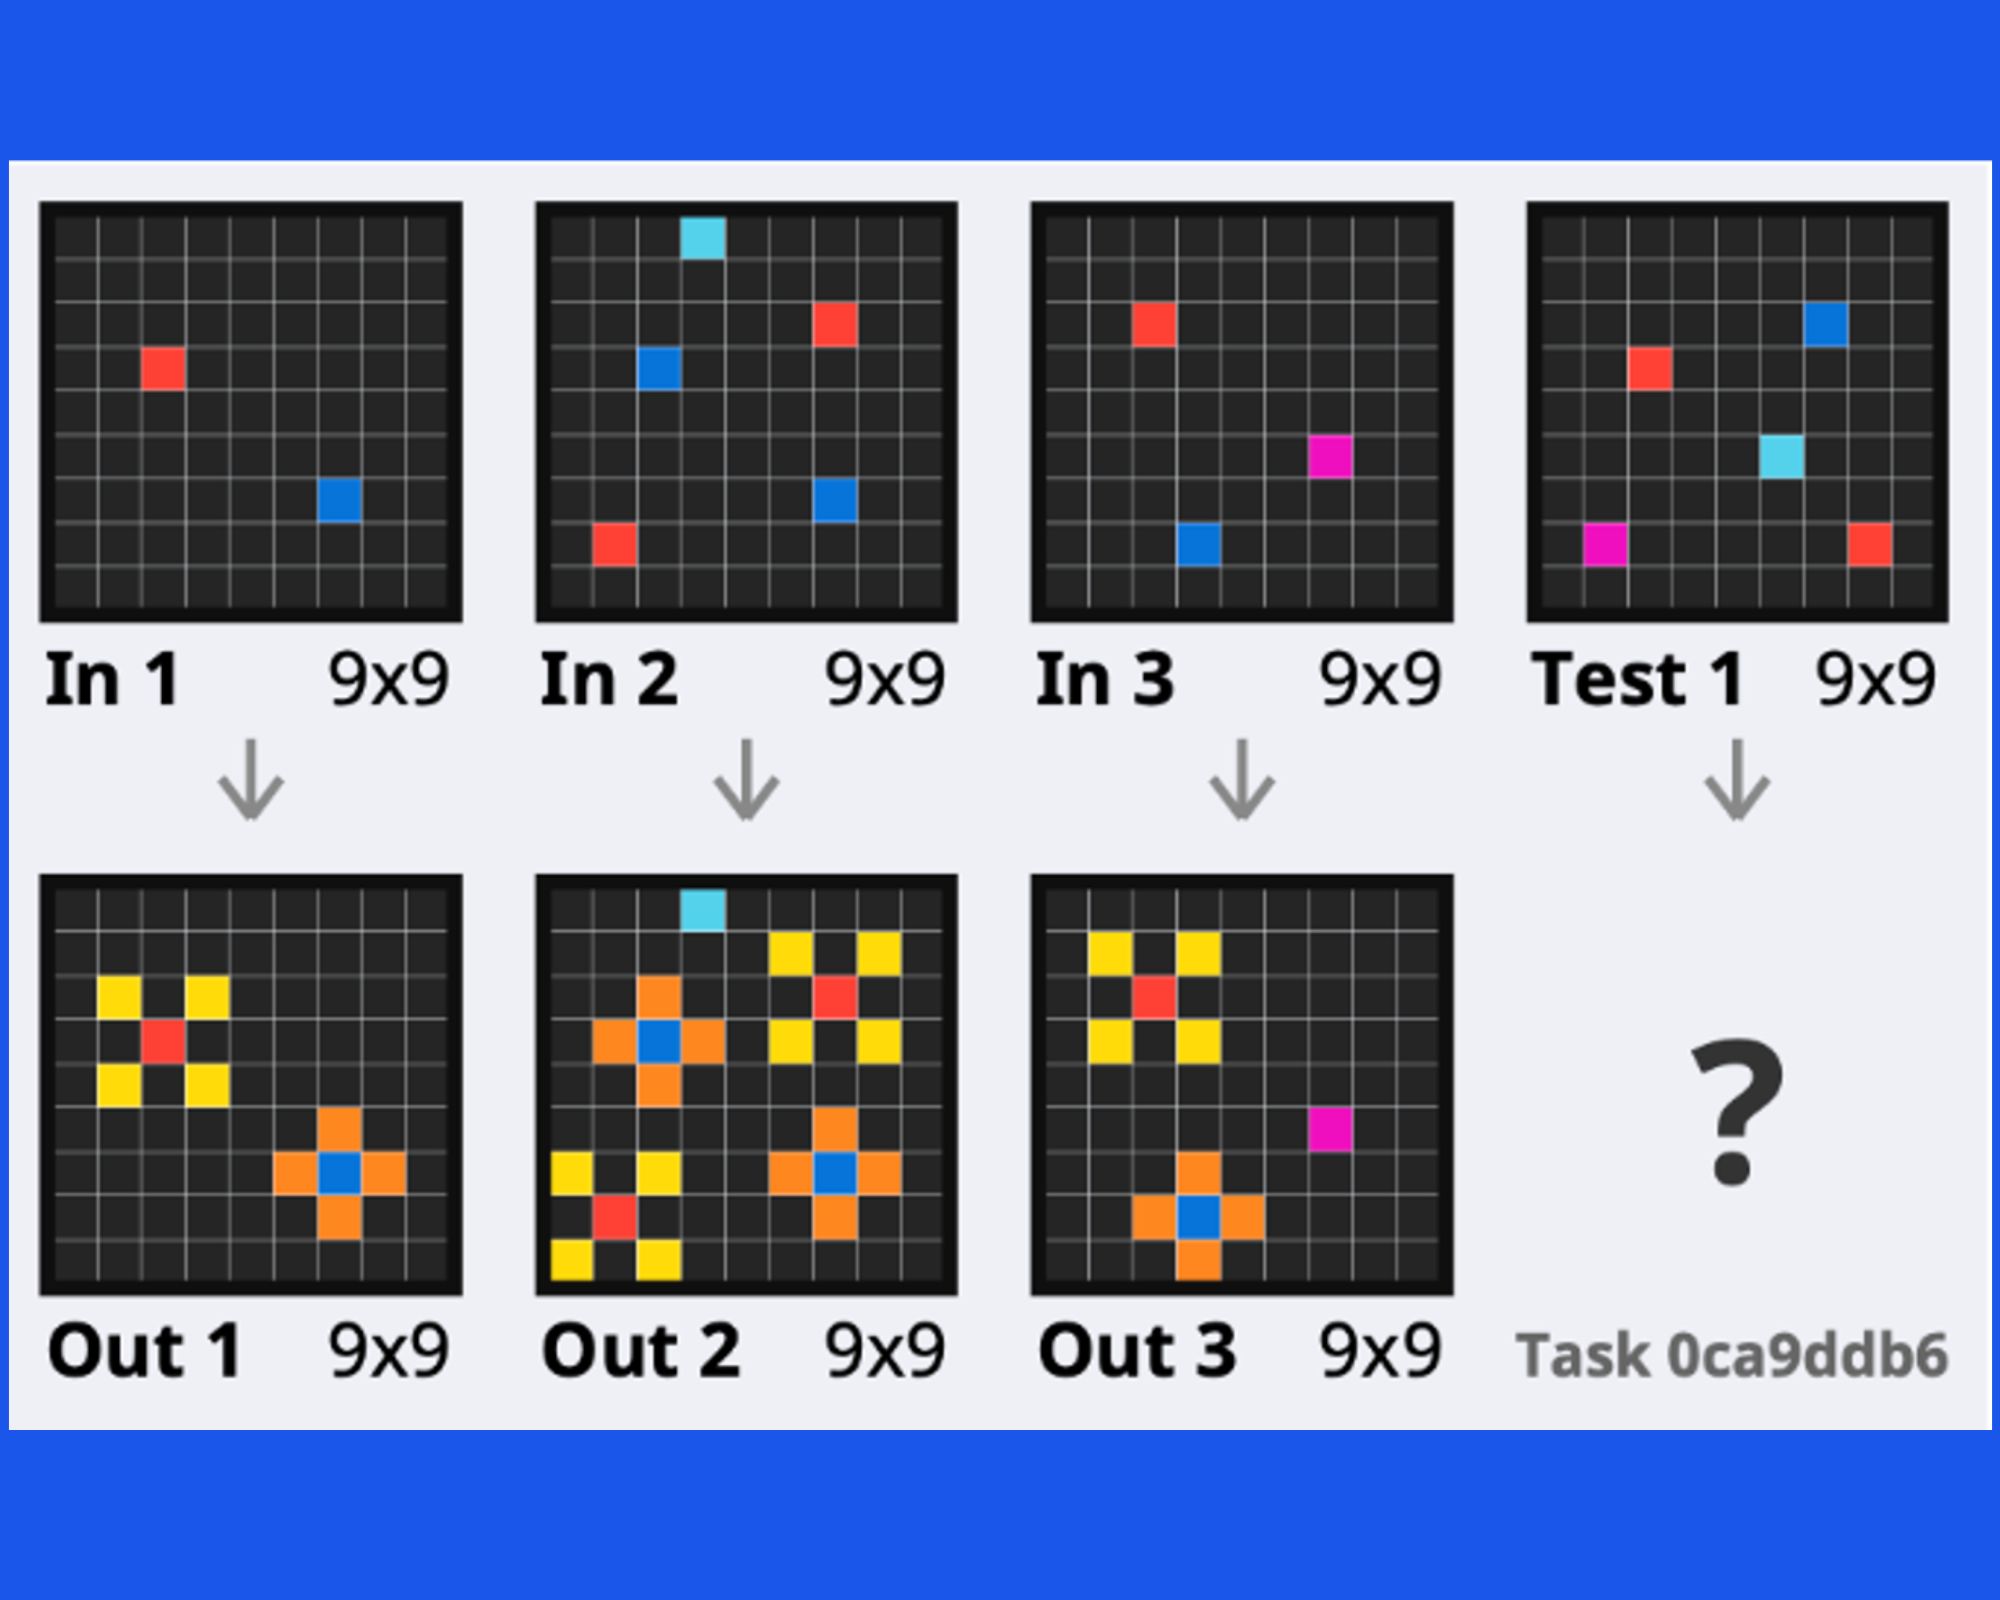
Towards broad generalization in machines
22 April 2024
Dr Toby Jackson, Postdoctoral Research Associate, Department of Plant Sciences
16 October 2023
Machine learning
Getting to the root of the problem
Trees enhance Cambridge and other cities by helping to reduce air pollution, providing shade in the summer and some beauty too. Local authorities across the UK have long-term strategies to increase the amount of tree cover in their cities, but measuring their progress is not simple. They need a reliable map of all the trees in the city, which can be updated every few years to check whether tree cover is increasing, which is exactly what we aim to provide in this project.
The first branch of enquiry
In April 2023, Cambridge locals got involved in a challenge at a citizen science event held at the David Attenborough Building, to outline as many trees as possible so they can be accurately mapped for maintenance (Figure 1). The event was funded by a grant from the Accelerate Programme for Scientific Discovery and Cambridge Centre for Data Driven Discovery (C2D3), without which this project would not have been possible.
The volunteers worked from high-resolution aerial photographs covering Cambridgeshire to outline as many trees as possible in the four-hour session. But with thousands of trees to document, a solution was needed to scale up their efforts.
An intelligent approach to growth
Andrés Zúñiga-González, a Masters student on the Cambridge Artificial Intelligence for Environmental Risks program, took up the challenge to use AI to make a city-wide tree map. He used a convolutional neural network called detectree2 , which was designed to delineate tree crowns in tropical forests from aerial RGB imagery. The initial results were pretty bad, because the trees in Cambridge look very different to those in a dense tropical forest!
To improve the accuracy of the model for the purpose of this project, Andrés used data from the citizen science day to train it further in recognising local trees. This increased the accuracy of the model dramatically and Andrés was able to produce the tree map shown here. The map contains 150,000 trees, and will hopefully help the local authority manage these trees, but there are still challenges ahead.
The risk of barking up the wrong tree
While the machine learning model is good at finding trees, it is unable to tell one tree species from another. This is an important distinction for tree management. For example, Ash (Fraxinus excelsior) is the most common tree species in Cambridge. Sadly, this species is severely threatened by the ash-dieback disease, and with no known cure, the vast majority of these ash trees will be killed by this pathogen over the next few decades.
This means that local authorities need to identify and possibly replace these ash trees as soon as possible. But if they used our model as it is now, they may be left barking up the wrong tree!
We therefore need to label all the ash trees on our map. Automatically classifying tree species is a daunting task, because they look pretty similar to each other in an aerial photo. Previous studies have used images with lots of different spectral bands (not just red-green-blue) collected from drones to classify tree species. This works quite well, but it’s expensive and hard to scale up.
However, we believe it might be possible to distinguish Ash trees from other species using a series of images over the growing season, as one distinctive feature of ash trees is that they tend to get their leaves later than other species.
Growing our impact
We’re currently testing this idea using Planet data which is freely available to academics almost daily at 3m resolution. This time-series data increases the accuracy of our species classification from 55 %, which is not much better than chance, to 75%. While this is good, we still have work to do.
One of the main challenges we have to somehow overcome is that Cambridge is a pretty cloudy place in April and September, which are the critical months to measure these differences .
Building on our work from the Accelerate and C2D3 grant, I hope to focus on making this tree mapping work useful for the local council and potentially others in the UK. It could also be applied globally with some more training data in each different biome. There’s plenty of room for growth.
Image: Citizen science tree mapping event. Bottom: Aerial photo of Cambridge (Fen Causeway) with trees automatically segmented and species labels overlaid in right hand image. The colours represent different tree species (pink = ash, purple = beech, green = alder, blue = birch, yellow = cherry and brown = willow).
Toby was awarded funding through the Accelerate Science and the Cambridge Centre for Data Driven Discovery funding scheme in 2022, you can read more about the awarded projects here.
22 April 2024
18 March 2024

4 March 2024
19 February 2024